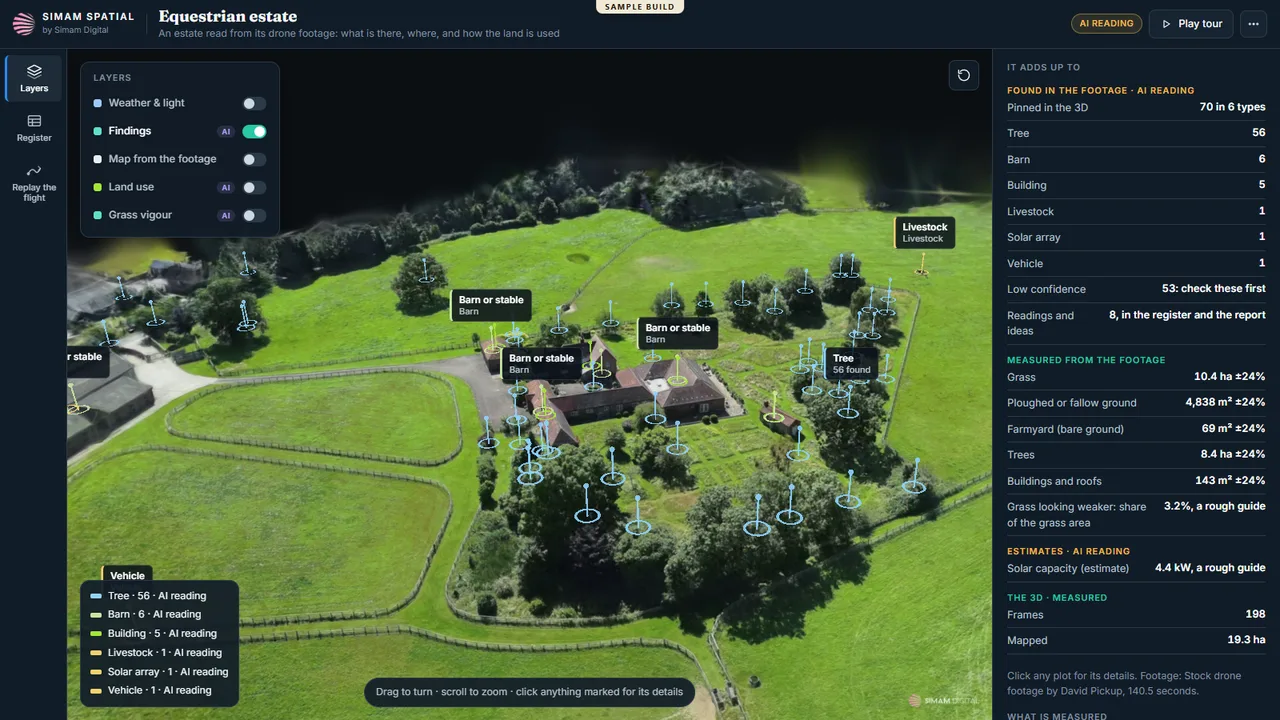
- 1 · The estate
- 2 · The smallholding
- 3 · The wheat belt
The full farm intelligence behind the three farm tours. Each farm is a 3D twin with every finding from its drone footage pinned where it is: trees, barns and buildings, livestock, solar arrays, water tanks, vehicles and haystacks, each with its confidence and the frame it came from. Layers add land use and grass or crop vigour mapped from the footage, a map made from the footage itself, weather and light, and a replay of the drone's flight. The panel adds it up: areas of grass, crops, ploughed ground, yard and trees, solar capacity and harvest estimates, and the findings to check first. An English equestrian estate (85 findings), a smallholding on the plains (83) and a wheat-belt farm (29).
What we measured
| Measure | Result | Note |
|---|---|---|
| Findings | 197 | 85 + 83 + 29, each from the footage, with confidence and source frame |
| Farms | 3 | One drone flight each |
| Maps | Land use + vigour | Made from the footage, with measured areas |
| The other two | Linked | /demos/farm-smallholding-twin and /demos/farm-plots-twin |
What went wrong
- The public farm tours had shown four zones and a handful of labels, a big step down from what the analysis found. These twins put every finding back, and each tour now links to its twin.
What happens next
- A farm's own records (fields, herds, contracts) on the same map.
- A second flight a season later, compared.